Are we past peak ? II

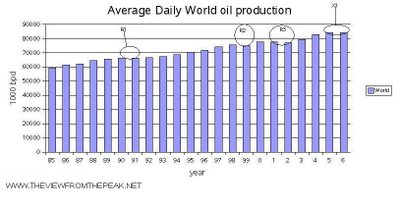
EIA has updated the data with average daily production numbers for the month of June, 2006. Average daily production for the first six months of 2006 is slightly below the 2005 average. This is despite the drop in production during Sep-Oct 2005.
Looking at the 20 year history of oil production, oil production has either declined or stayed flat during 3 periods, represented by R1, R2 & R3.
- The period marked as R1 was the first Gulf war and the recession in US and the beginning of deflation in Japan.
- R2 is when the Asian currency crisis and the subsequent meltdown in the high growth economies of Asia.
- R3 is the implosion of the dot com bubble in the US.
Note: Click on the chart to see larger image.

